PROFIBUS Tester FAQs
Elimination of transmission problems using Softing‘s PROFIBUS Tester 5?
Please refer to the following PDF for a detailed explanation: Elimination of transmission problems using Softing‘s PROFIBUS Tester 5
When is a quality index “good”?
The quality index strongly depends on the type of field device and, in particular, on the segment length. In the majority of cases, a quality index of 4000 is very good. However, bus communication may still work with much less.
The topology scan does not detect the same devices as the station scan
The topology scan uses a maximum baud rate of 500 kbit/s, even if you have set higher baud rate. As a result, devices that do not support automatic baud rate detection and have been set to a higher baud rate will not be found in the topology scan. Some (mainly older) devices will perform the automatic baud rate detection only once after startup. Therefore, you may have to temporarily disconnect them from the power supply.
What do do when the actual layout of the field devices does not match the topology scan?
The PROFIBUS Tester measures the cable lengths to the respective slaves and then lists the slaves according to the cable lengths.
To perform a topology scan, the PROFIBUS Tester should be connected to the beginning of the physical segment. Consequently, when measuring the cable lengths from the center of a segment, the sequence of slaves determined by the PROFIBUS Tester will not correspond to the actual layout of the slaves.
In addition, a topology scan will only deliver reliable results, if the signal quality of all slaves on the bus is very good. If faults have already led to reflections on the bus, the reflections can impact accurate length measurement by the PROFIBUS Tester.
The measurement tolerance for the topology scan is +/- 1 meter.
The use of repeaters creates separate physical segments. For this reason, repeaters need to be disconnected from the bus (disconnect power supply or unplug the PROFIBUS cable) before running a topology scan. Each segment has to be measured separately.
Problems with USB hubs
This is a common issue depending on the PC/notebook type and operating system. It occurs particularly when using USB hubs with external power supply. Please connect the PB-T3 directly to the PC/notebook.
PROFIBUS Tester Calibration
The PROFIBUS Tester is maintenance-free and does not need to be calibrated. The PROFIBUS Tester does not measure physical values which can be compared to a reference standard.
A calibration takes place during the automatic production tests of the PROFIBUS Tester device before the delivery.
But we can offer a factory adjustment like it is done during production for extra charge. If you have interest on it, please contact our sales department: [email protected]
How to activate the PA option on your BC-700-PB?
Please read the following application note.
What is the oscilloscope function of BC-700-PB?
The new Firmware 1.02.00.00 of the BC-700-PB (delivered with the PROFIBUS Diagnostics Suite V3.20) contains an oscilloscope function for stand-alone operation. The waveform of the PROFIBUS signal can be seen now on the display of the BC-700-PB without connected PC. Therefore an examination of the waveforms is possible in a simple manner. The signal A-B is shown with a maximum sampling rate of 384 MHz and 8192 sample points. It can be triggered on addresses, signal level and faulty telegrams. Sections can be shown per zoom and shift function. The presentation is intended as a "Live View", saving the contents on the PC is not possible. For this purpose the oscilloscope function in the PROFIBUS Diagnostics Suite should be used.
The oscilloscope function in stand-alone mode is enabled via an additional license, which is bound to the serial number of the device. Therefore the serial number must be stated when ordering the license. Customers who already own the PA option should also state the key of the PA license in order to ensure that the PA function is included in the new key.
The oscilloscope function in the PROFIBUS Diagnostics Suite is still available without any additional license.
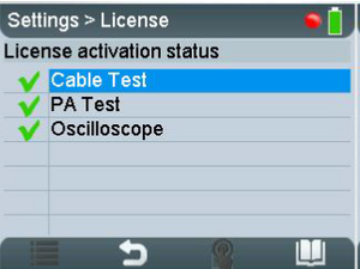
Which license is activated in the BC-700-PB?
Activated licenses are displayed in the BC-700-PB in menu Settings -> License.
Disabled functions or functions without a license will be grayed out or are not visible in the main menu in stand-alone mode.
Hint
When USB is connected you can view the license activation status in PC-software PROFIBUS Diagnose Suite (Help -> Hardware Info).
You can also see the installed licenses in the Softing License Manager V4. Select Softing Interface and then Interface Licenses tab. The connected device together with its serial number, installed options and license key is displayed.
PROFIBUS Diagnose Suite
Can I use several devices to measure the PROFIBUS system?
While several devices can be simultaneously connected to the bus, you must choose one device at a time to run a measurement on the active bus with the PROFIBUS Diagnostics Suite. The measurement cannot be started using several devices simultaneously.
Where can I find the CSV export functionality?
To use this functionality, you have to have installed the latest version of the PROFIBUS Diagnostics Suite.
To save the recorded frames to a CSV file, click the Print icon in the Frames view. After you select the range, a preview window appears. Click on the Save icon in the toolbar at the top of the preview window and choose 'CSV'. You can then specify a name and location for the file.
Is it possible to run a trend test in DP and PA segment simultaneously using BC-450-PB?
Using BC-450-PB you can test the protocol simultaneously in DP- and PA-segment. Before running a trend test you have to decide in which segment (DP or PA) you want to run a trend test. Running a trend test in DP- and PA-segment simultaneously will lead to wrong test results. Please run a trend test in the corresponding segments separately.
I am running a trend test using BC-502-PB. Why sometimes the GUI freezes when starting the trend test?
The graphical user interface of PB-DIAG-Suite freezes when starting a trend test, if the live list does not contain any stations.
This is a reported issue in version 2.10 of PB-DIAG-Suite. To prevent this issue, please run a station scan prior to the trend test.
This bug is fixed in the version 2.11.
When I am clearing the network status via context menu in project explorer, sometimes an error message is displayed.
This is a reported issue in version 2.10 of PB-DIAG-Suite. To prevent this issue, please open the corresponding network status and press the corresponding display control “Clear Network Status”.
This bug is fixed in the version 2.11.
When I am running the oscilloscope function sometimes error messages are displayed.
I am testing a network which runs a bitrate of 9,6kbit/s. When I am running the oscilloscope function sometimes error messages are displayed.
This is a reported issue in version 2.10 of PB-DIAG-Suite. The correction is scheduled for the next version.
PB-DIAG-Suite displays in status bar strange processing lag values...
When I am running the oscilloscope function, PB-DIAG-Suite displays in status bar strange processing lag values and/or bus status shows “red”, although the network is okay. Why this is the case?
Running simultaneously telegram recorder and oscilloscope function is principally possible. In version 2.10 of PB-DIAG-Suite this configuration will cause the above mentioned reported issue.
To prevent this issue, please decide in favour of one function and stop the other function (oscilloscope or telegram recording). The correction is scheduled for the next version.
I have simultaneously connected BC-4x0-PB and BC-600-PB to PB-DIAG-Suite via USB.
I have simultaneously connected BC-4x0-PB and BC-600-PB to PB-DIAG-Suite via USB. What do I have to bear in mind?
In principle the operation is the same as compared to operation on a single device. In version 2.10 of PB-DIAG-Suite opening a channel via selection of the corresponding device in project explorer may cause an error message. To prevent this reported issue, please select the corresponding device on the start page. The correction is scheduled for the next version.
When starting a trend recording the displayed logging period is not “Zero”.
When starting a trend recording using PB-DIAG-Suite, the displayed logging period is not “Zero”. Why this is the case?
BC-600-PB contains an internal clock, which starts to run from “Zero” whenever a recording is started (frame recording, protocol analysis or trend recording). Typically a trend recording shall start at “Zero”. To prevent this reported issue we recommend to stop all other running functions such as the frame recorder. After that you can start trend recording.
When opening a frame recording my mouse pointer continues to show an hour glass.
When opening a frame recording (rpb-file) my mouse pointer continues to show an hour glass. Why this is the case?
Typically opening a telegram recording (rpb-file) in offline mode takes a couple of seconds. During this data input of information, the cursor changes its appearance (hour glass). Is the measurement device being plugged to a master device (test location) during the frame recording, the mouse pointer remains an hour glass and the processing lag value being displayed in status bar is growing continuously. This reported issue does not affect any available functions (such as search frames function) and will be fixed in the next update version.
Measurement is not possible even though the BC-700-PB is recognized correctly
Measurement can be performed in stand alone mode and all devices are detected properly.
However, the BC-700-PB is not detected if you try to do a measurement with the PROFIBUS Diagnose Suite software. In this case no measurement can be performed or the baud rate setting is "forgotten". Such a phenomenon has been observed with USB cable with a length of 2 meter or longer.
Workaround:
Please use a USB cable with a maximum length of 2 meters or shorter.
The topology measurement is not displayed in the generated report
If you only see question marks rather than a meter value in the generated report then you should change to the Topology tab with connected BC-700-PB (very important) and assigned Network. Then click here the button “Copy to Global”.

How to configure and use the trigger input?
Please configure the Trigger Condition in the Diagnostics Suite. The External (Trigger In) should be used as source for the trigger in the Oscilloscope View.
You need an external device (e.g. voltage measurement equipment) which triggers the PBT5 in case of e.g. voltage decrease. The reason is to find out whether the voltage decrease influences the PROFIBUS installation.
Please note, the external trigger input can only start the oscilloscope measurement but not the frame recording.
How to use the trigger output
The external trigger output works exactly like the trigger in the Oscilloscope View, but with a small delay caused by the hardware driver.
So when the Oscilloscope View is active, trigger signals corresponding to the current oscilloscope trigger mode (address or voltage level) are generated at the trigger output pin.
In turn, the external trigger input may be used as source for the trigger in the Oscilloscope View.
Signal quality measurement reports „Timeout“

Bus participants incl. bus addresses will be displayed during the signal quality measurement, but not the signal bars. Instead of that only the text “Timeout” appears.

If a quality index could not be determined within the specified time, the text "Time-Out" appears. You should check the station in this case or increase the "Measurement time-out" setting in the Signal Analysis Settings dialog box (menu Test -> Signal analysis setting).
At the bottom of the “Evaluation” tab, you can set a timeout for the signal analysis measurements. If a station does not exist or if a measurement cannot be properly completed for other reasons, the measurement is aborted for that station after the specified time and the next measurement is started. Because a signal analysis measurement always has to capture multiple frames of a station, you may need to increase the timeout setting when testing networks with many stations or low baud rates.
Error message: error in XML document (0,0)
Maybe a configuration file is faulty, therefore the PROFIBUS Diagnostics Suite software can no longer be loaded.
Workaround:
Please navigate to the folder C:\ProgramData\Softing\PROFIBUS\Diag Suite\config
Check the files in that folder. If you find a file with a length of 0KB, delete it. If the file lengths are plausible, delete the file RecentData.cfg.
The missing configuration files will be created during the startup of the software.
After deleting the files the software should work properly again.
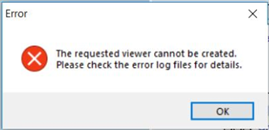
Error message: The requested viewer cannot be created
Please delete the snapshot file (last.npb) in the directory:
C:\ProgramData\Softing\PROFIBUS\Diag Suite\network\snapshots\last.npb
The file seems to be faulty.
No access to functions for analyzing oscillograms and frames
You can choose between two different user modes for the workspace:
- Advanced mode and
- Standard mode.
When you enable Standard mode, the expert functions for analyzing oscillograms and frames are not available. This mode gives new or less experienced users a clear, easy-to-use user interface with the standard display and control functions.
To change the user mode, open Settings from the menu bar and select User Mode.
Then the oscillogram and frame functions will be visible.
Configuration and trace files
If you are asked for the configuration files and / or trace files in a support case, you will find them in the following folder:
%ALLUSERSPROFILE%\Softing\PROFIBUS\Diag Suite\
This location may vary depending on the language and version of the Microsoft Windows operating system.
e.g. C:\ProgramData\Softing\PROFIBUS\Diag Suite\
Please archive the complete folder and send it to [email protected]. This folder contains the configuration files, log files, and much more.
C:\ProgramData\Softing\PROFIBUS\Diag Suite\config
C:\ProgramData\Softing\PROFIBUS\Diag Suite\logs
...
If there are problems with a GSD file then please also send the following folder:
C:\ProgramData\Softing\PROFIBUS\gsd
Traces:
By default, only the exception logging is activated, which can be found in the program data directory at:
C:\ProgramData\Softing\PROFIBUS\Diag Suite\logs
In most cases, this information is sufficient to investigate.
However, in some cases, extended log files (application log files) are required.
To enable application logging, you should also perform the following steps:
1. Open PDS
2. Press CTRL+SHIFT+T to open Tracer settings window
3. Select module “Main”
4. Check field “Enabled”
5. Change level to “DEBUG”
6. Rotation type can be kept in default “by date” and “Daily”
7. Click “Ok”

The application log files (AppStatus.trc) can be found at:
C:\ProgramData\Softing\PROFIBUS\Diag Suite\AppStatus.trc

Softing Industrial Support
PSIRT – Product Security Incident Response Team
psirt[at]softing[dot]com